Vault Mobile - Insurance

SUMMARY
The DRP Insurance product within Vault Mobile gives users a quick glance at their quarterly coverage within a crop year.
This assignment had a tight deadline due to an upcoming build date, so we had to move fast to align on a solution.
CLIENT
Agriculture tech company
MY ROLE
Lead Product Designer assisting the Design Director.
Skip ahead to the good stuff

Overview
Problem
Based on the main tasks users are looking to accomplish using this feature, the current hierarchy of data in the existing design does not offer an efficient solution.
Constraints
This assignment had a tight deadline due to an upcoming build date, so we had to move fast to align on a solution.
DRP Insurance 101
Dairy Revenue Production Insurance (DRP) allows users to buy a policy within a crop year from an Approved Insurance Provider (AIP) to protect products against price fluctuations.
Key facts:
-
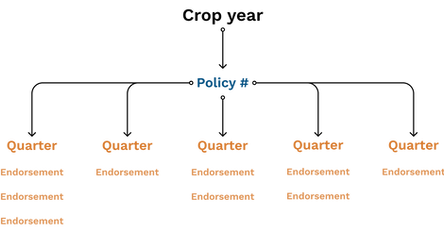
Crop years consist of 8 quarters
-
One policy allowed per crop year (Exception for multi-org establishments)
-
Users can only have coverage for up to 5 quarters at a time
-
A policy is only active once an endorsement (% of coverage) is purchased within a quarter


Who uses DRP Insurance?
Growers and producers are the most common users of DRP Insurance and use the DRP product daily.
Typical tasks:
-
Identify their policy P/L per for the most recent closed quarter.
-
Determine if they need to purchase additional coverage through endorsements for active quarters.
Prioritize Quarters
Using a diagram I built to help our team better understand the hierarchy of the DRP system, we determined that the original designs endorsement led solution was the root of the confusion.
As a team we decided to propose a new solution that prioritized quarters to the client.
Main points:
-
Improved hierarchy: Quarter Dashboard --> Overview page --> Endorsement list
-
Separated quarters by Current, Upcoming, and Past
-
Leveraged color as a way to help define quarter sections based on DS guidelines.


Establish the MVP
The Design Director and I combed through the feedback from the presentation and broke down our MVP into two sections.
Quarter Dashboard - A page dedicated to giving users a high level view of:
-
Closed quarters
-
Open quarters
Quarter Overview Page - An in depth view of each quarter and the endorsements purchased within it.

Quarter Dashboard
Set a Framework
After a series of meetings with the client we aligned on the required elements the page must include to meet user needs.
Sections:
-
Closed Quarters
-
Open Quarters
Section details:
Content cards established by the design system
Status tags to identify if a quarter is closed or active


1. Closed Quarters
Assumption: We initially assumed that users would get the most value out of having open quarters be visible before closed quarters.
Reality: We learned that the most recent closed quarter is the most important data for users to see first. This data informs users how much money they owe or will get back from their insurance provider for that quarter.
Solution: The most recent closed quarter is fixed at the top of the page with all necessary data.

1. Open Quarters
Open quarters inform users of how much of their product is covered and the current P/L. This high level glance assists users in making an informed decision on future endorsement purchases.
Assumption: In the original design we pitched, we broke all non-closed quarters into either current or upcoming.
Reality: We learned that if a quarter is not closed, it is then considered open (active).
Solution: Combine all open (active) quarters together in a list view.


Design Solution
Quarter Overview
Quarter Overview
Staying true to the hierarchy we established, we designed a Quarter Overview page that lists all purchased endorsements within the selected quarter.
This redesign gave us the opportunity to highlight even more helpful data related to that quarter.
Required Data:
-
Effective Production
-
Declared Production
-
Revenue Guarantee
-
Premium
-
Est. Indemnity
-
Est. P/L
-
Endorsement list


Design Solution
Full Flow

Final Thoughts
Accomplishments

Clear Hierarchy
Users can now clearly see their coverage per quarter against price fluctuations.

Improved Navigation
Users can more easily complete tasks due to navigation updates

Launched
Available at the Apple storeand Google Play

